I didn’t plan on becoming “the stats person.” But my little cousin asked me to help her pick a college. She wanted to feel safe. I wanted facts, not rumors. So I spent a few weeks looking at campus sexual assault numbers. I used the big sources that schools and news folks use. And yes, I took notes like a nerd. If you want the step-by-step version of my data hunt, I laid it all out in a longer piece right here.
You know what? The numbers are heavy. But they help.
What I used (and how I used it)
- AAU Campus Climate Survey: This is a big student survey from many colleges. I read their summaries and the method notes.
- Clery Act data: Schools must report certain crimes each year. I went school by school and checked the Annual Security Report and the daily crime log.
- RAINN: Their pages explain what the numbers mean in plain words. I used them to cross-check rates and reporting patterns.
I also called one Title IX office, just to ask how they log cases. The answer was simple: not every report becomes a Clery number. That matters.
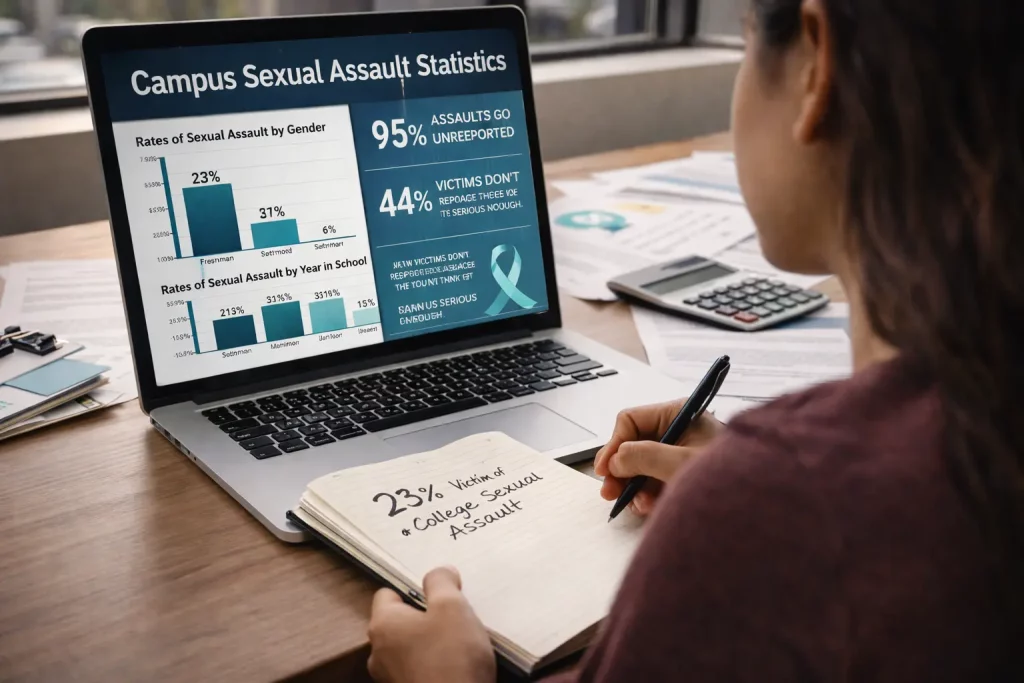
The numbers that hit me
- About 1 in 4 undergraduate women say they faced sexual assault or contact without consent. Surveys like AAU say this.
- For undergraduate men, it’s about 1 in 14.
- For trans, nonbinary, and gender-diverse students, it’s close to 1 in 4.
- Most students don’t report to police. RAINN says only about 1 in 5 student victims tell law enforcement.
So when I saw a college list “two rapes” in a year, I didn’t cheer. I asked, does that match the survey rates? Usually, it doesn’t. And that gap tells a story.
A week that said a lot
One small thing stood out. I watched a daily crime log during September. More entries popped up near the start of fall. RA training talks about this “Red Zone,” the first weeks when risk goes up. Those logs echoed that pattern. Fewer entries in July. More in early fall. It wasn’t loud data, but it felt real.
Why the numbers don’t line up
Here’s the thing. Clery numbers and survey numbers are not the same kind of number.
- Surveys ask students what happened to them, on or off campus, even if they never told anyone.
- Clery counts crimes in set campus areas and only when someone reports in a way that fits the rules.
- Terms differ. “Rape” in Clery has a legal frame. Surveys ask about actions, like “someone did X without consent.”
- There’s lag. Reports can take months. Some never get logged at all.
So yeah, a big school can report single digits for a year. And the survey can still say “1 in 4.” Both can be true at once.
Real examples that helped me compare
- AAU surveys show high rates across many campuses, year after year. About 26% of undergrad women and around 6–7% of undergrad men report assault or sexual contact without consent.
- RAINN points out the low reporting rate to police for students. About 20%.
- Clery reports often list very few rapes each year, even at large schools. They also include fondling, dating violence, domestic violence, and stalking, but the totals still look small next to survey rates.
I used those three facts together when my cousin asked, “Is this campus safe?” I didn’t say yes or no. I said, “Let’s look at all three and then ask what support this school gives.”
What helped me, beyond the numbers
I liked when a school had:
- A clear, easy page on how to report and what happens next
- A 24/7 line that led to a real person
- Annual training that wasn’t just slides
- Climate surveys posted, not hidden
- A map or note on what areas count as “campus” for reports
Even an anonymous chat tool like InstantChat offers secure, on-demand messaging that campuses can embed on their support pages so students can connect with trained advocates without having to make a phone call.
One resource that helped me translate policies into plain-language action steps is EndCampusSexualAssault.com, which gathers reforms, survivor stories, and campus tools in one place.
For transgender and gender-diverse students who sometimes look off campus for community or social opportunities, having vetted, identity-affirming listings matters just as much as on-campus support. A thoughtfully moderated directory such as TS escort Taunton provides verified profiles, clear safety guidelines, and user reviews that can help adults make informed, boundary-respecting choices before meeting someone in person.
Where the data fell short
- It’s hard to compare schools fairly. One campus might report more because folks trust the system. That can look “worse” on paper when it’s actually a sign of trust.
- The daily crime log uses formal labels. Students don’t talk that way. It can feel cold.
- Some reports get reclassified. Some get dropped. It’s a lot for a family to parse. For students considering legal counsel when campus processes feel overwhelming, I found this honest review of hiring a campus sexual assault lawyer in Los Angeles surprisingly clarifying.
Honestly, I got frustrated. Then I took a breath and kept reading.
Quick tips if you’re reading these stats for someone you love
- Look at three buckets: survey rates, Clery reports, and support services.
- Check the “Red Zone.” Ask how the school staffs those first six weeks.
- Ask the Title IX office how they track reports and what “confidential” means on campus.
- Scan the daily crime log for trends, not just the total.
- Read the student paper. Real stories add context the numbers miss.
My take, plain and simple
Do the numbers scare me? A bit. But they don’t make me give up on college life. They make me ask better questions.
Here’s my simple rule: Surveys tell you how common harm is. Clery tells you what got logged where. Services tell you how a school shows up when it counts.
Put those three together, and you get a picture that’s closer to the truth. Not perfect. Closer.
And if you’re reading this while packing for fall? Keep the hotline numbers saved, go to the training, set up buddy plans, and know your routes home. Safety isn’t one big move. It’s a stack of small ones—done early, done often, done together.
That’s what I learned, and it stuck.